
| OCDC Population by Housing Status and Race | |||
| Snapshot population as of July 06, 2026 at 11:53 AM | |||
| Race | Housed | Unhoused | Total |
|---|---|---|---|
| American Indian | 9 (0.7%) | 2 (0.8%) | 11 (0.7%) |
| Asian Pacific Islander | 12 (0.9%) | 3 (1.2%) | 15 (0.9%) |
| Black | 606 (44.5%) | 108 (42.5%) | 714 (44.2%) |
| Hispanic | 201 (14.8%) | 21 (8.3%) | 222 (13.7%) |
| Middle Eastern | 5 (0.4%) | 1 (0.4%) | 6 (0.4%) |
| Native American | 47 (3.5%) | 14 (5.5%) | 61 (3.8%) |
| Native Hawaiian Pacific Islander | 2 (0.1%) | NA (-) | 2 (0.1%) |
| Unknown | 5 (0.4%) | 1 (0.4%) | 6 (0.4%) |
| White | 474 (34.8%) | 104 (40.9%) | 578 (35.8%) |
| Total | 1,361 (100.0%) | 254 (100.0%) | 1,615 (100.0%) |
| Source: OK Policy Institute analysis of data from the Oklahoma County Detention Center's 'Jailtracker' system. | |||
| Note: Demographic categories are as recorded by OCDC staff. | |||
1 Data / Methodology
The data for this report come from the Oklahoma County Detention Center’s (OCDC) JailTracker information system. Data includes information on all people booked into OCDC custody through July 06, 2026 at 11:53 AM.
OCDC collects data on housing status from each person booked into the jail. We impute whether each person was unhoused at the time of their booking by assessing their given address – if they gave their address as “homeless”, “unhoused”, “0000000”, “transient”, etc., our methodology counts them as being unhoused. Otherwise, they are counted as housed.
2 Housing Status: Current Population
Of the 1,615 people currently in OCDC custody as of July 06, 2026 at 11:53 AM, we identified 254 (or 15.73% of the total) as unhoused at the time of their booking.
2.1 Current Population: Demographics
The following tables provide demographic details of the unhoused population at OCDC at a single point in time.
| OCDC Population by Housing Status and Gender | |||
| Snapshot population as of July 06, 2026 at 11:53 AM | |||
| Gender | Housed | Unhoused | Total |
|---|---|---|---|
| Female | 209 (15.4%) | 31 (12.2%) | 240 (14.9%) |
| Male | 1,152 (84.6%) | 222 (87.4%) | 1,374 (85.1%) |
| Other | NA (-) | 1 (0.4%) | 1 (0.1%) |
| Total | 1,361 (100.0%) | 254 (100.0%) | 1,615 (100.0%) |
| Source: OK Policy Institute analysis of data from the Oklahoma County Detention Center's 'Jailtracker' system. | |||
| Note: Demographic categories are as recorded by OCDC staff. | |||
| OCDC Population by Housing Status and Age | |||
| Snapshot population as of July 06, 2026 at 11:53 AM | |||
| Age Group | Housed | Unhoused | Total |
|---|---|---|---|
| 25 & Under | 234 (17.2%) | 22 (8.7%) | 256 (15.9%) |
| 25-35 | 398 (29.2%) | 66 (26.0%) | 464 (28.7%) |
| 35-45 | 402 (29.5%) | 89 (35.0%) | 491 (30.4%) |
| 45-55 | 215 (15.8%) | 45 (17.7%) | 260 (16.1%) |
| 55-65 | 84 (6.2%) | 26 (10.2%) | 110 (6.8%) |
| Over 65 | 28 (2.1%) | 5 (2.0%) | 33 (2.0%) |
| No Data / Unknown | NA (-) | 1 (0.4%) | 1 (0.1%) |
| Total | 1,361 (100.0%) | 254 (100.0%) | 1,615 (100.0%) |
| Source: OK Policy Institute analysis of data from the Oklahoma County Detention Center's 'Jailtracker' system. | |||
| Note: Demographic categories are as recorded by OCDC staff. | |||
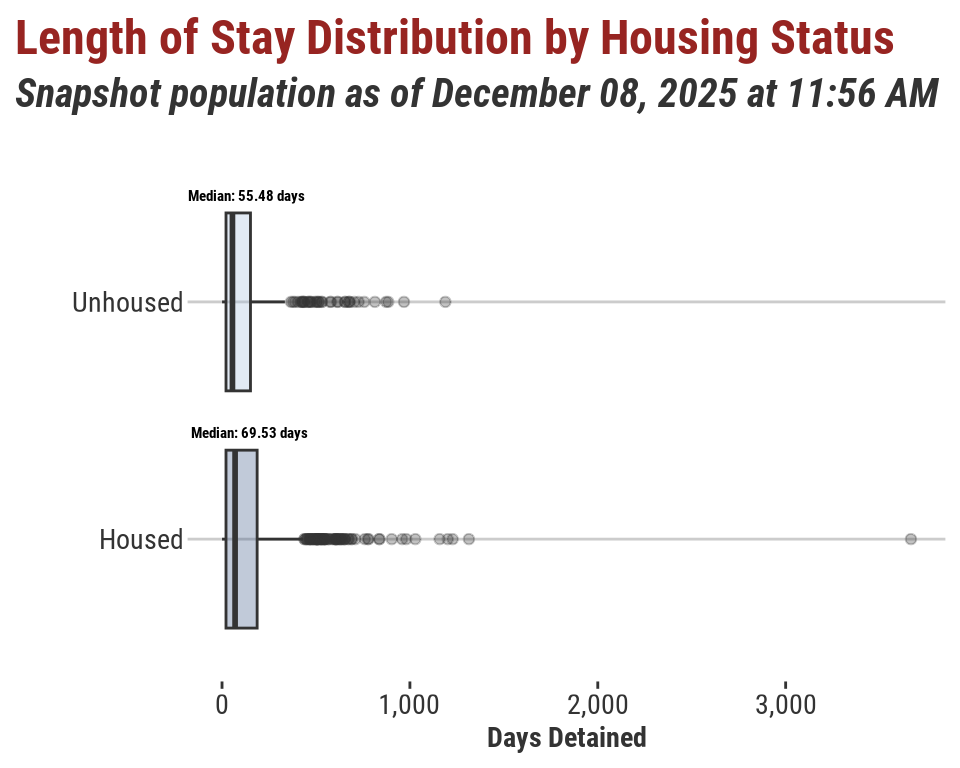
2.2 Current Population: Days Detained
The graph below shows how long each person currently in OCDC custody has been held there, broken out by housing status. The boxes denote the 25th - 75th percentiles (i.e. half of the total falls within those values), and the vertical lines denote the median value in each group.
| OCDC Population: Days Detained by Housing Status | |||
| Snapshot population as of July 06, 2026 at 11:53 AM | |||
| Days Detained | Housed | Unhoused | Total |
|---|---|---|---|
| < 24 Hours | 41 (3.0%) | 5 (2.0%) | 46 (2.8%) |
| 24 Hours - 7 Days | 172 (12.6%) | 29 (11.4%) | 201 (12.4%) |
| 7 Days - 30 Days | 304 (22.3%) | 50 (19.7%) | 354 (21.9%) |
| 30 - 100 Days | 380 (27.9%) | 76 (29.9%) | 456 (28.2%) |
| 100 - 365 Days | 346 (25.4%) | 64 (25.2%) | 410 (25.4%) |
| 1 Year+ | 118 (8.7%) | 29 (11.4%) | 147 (9.1%) |
| No Data / Unknown | NA (-) | 1 (0.4%) | 1 (0.1%) |
| Total | 1,361 (100.0%) | 254 (100.0%) | 1,615 (100.0%) |
| Source: OK Policy Institute analysis of data from the Oklahoma County Detention Center's 'Jailtracker' system. | |||
2.3 Current Population: Security Classification and Pretrial Status
People held in OCDC custody are assigned a security classification of “minimum”, “medium”, or “maximum” security. It is determined on the basis of the charges they are accused of and the ongoing observations of the jail staff, and can be changed over time. It often takes 24-48 hours for this to be determined; recent bookings that haven’t yet been assigned a security classification are marked “No Data / Unknown”.
| OCDC Population by Housing Status and Security Level | |||
| Snapshot population as of July 06, 2026 at 11:53 AM | |||
| Security Level | Housed | Unhoused | Total |
|---|---|---|---|
| Maximum | 545 (40.0%) | 86 (33.9%) | 631 (39.1%) |
| Medium | 589 (43.3%) | 117 (46.1%) | 706 (43.7%) |
| Minimum | 206 (15.1%) | 47 (18.5%) | 253 (15.7%) |
| No Data / Unknown | 21 (1.5%) | 4 (1.6%) | 25 (1.5%) |
| Total | 1,361 (100.0%) | 254 (100.0%) | 1,615 (100.0%) |
| Source: OK Policy Institute analysis of data from the Oklahoma County Detention Center's 'Jailtracker' system. | |||
Generally, the majority of the people held in OCDC at any given time are being held pretrial, meaning they have not yet been convicted and are being detained as their case proceeds through the court system. We count anyone who has not received a judgement in any of their cases and has not been sentenced to time in the jail in this group.
| OCDC Population by Housing Status and Pretrial Status | |||
| Snapshot population as of July 06, 2026 at 11:53 AM | |||
| Pretrial | Housed | Unhoused | Total |
|---|---|---|---|
| Pretrial | 1,130 (83.0%) | 190 (74.8%) | 1,320 (81.7%) |
| Sentenced | 231 (17.0%) | 64 (25.2%) | 295 (18.3%) |
| Total | 1,361 (100.0%) | 254 (100.0%) | 1,615 (100.0%) |
| Source: OK Policy Institute analysis of data from the Oklahoma County Detention Center's 'Jailtracker' system. | |||
3 Housing Status: Recent / Historical Trends
Looking at a snapshot in time only tells us part of the story – for example, those with more serious charges tend to be held longer, meaning the median time detained will always be significantly higher when looking at a snapshot in time as opposed to all bookings in a given timespan. In order to see what these unhoused bookings look like from start to finish, and how they’re changing in the long term, we analyze recent and historical trends below.
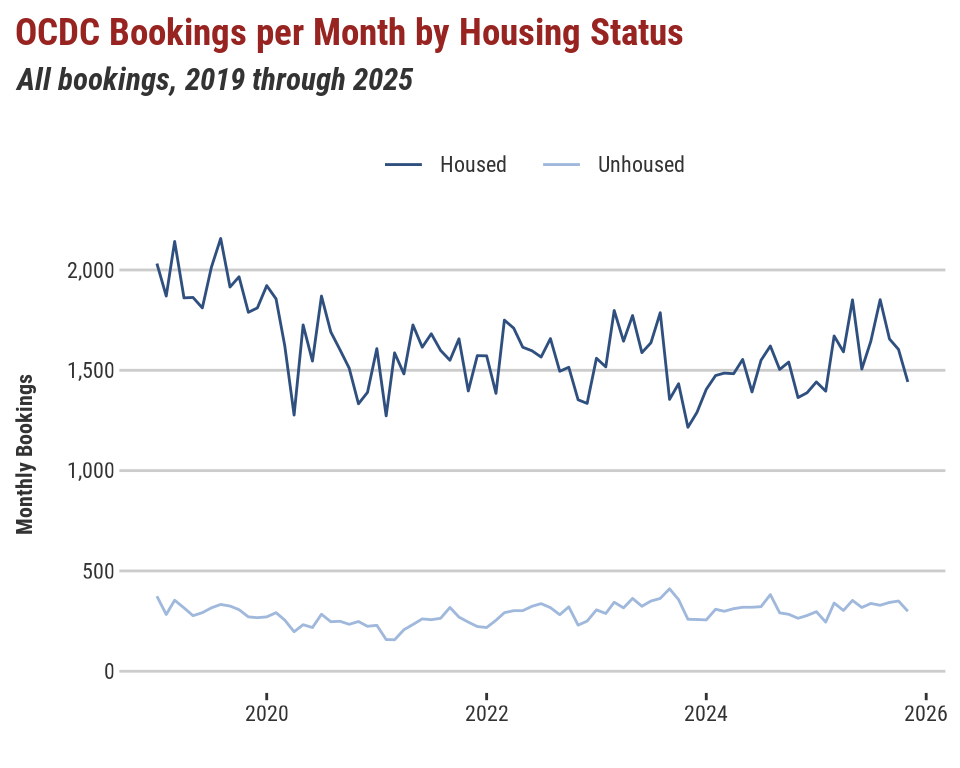
3.1 Trends: Booking / Release Rates
The graph below shows the number of people booked into OCDC custody each month for the past 6 years, by housing status.
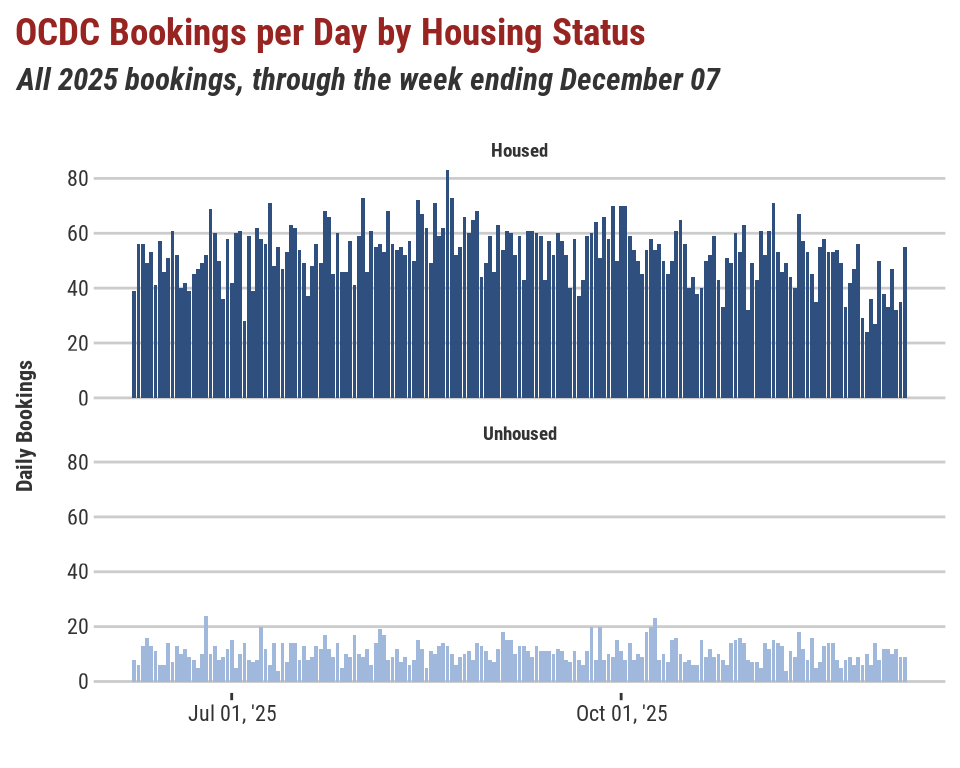
A more zoomed in version, showing bookings per day in the past six months only, appears below.
3.2 Trends: Avg. Length of Detainment
The chart below shows the median number of days each person booked into the jail was held in total, by the month of their initial booking. Those currently in custody have their length of detainment calculated through today.
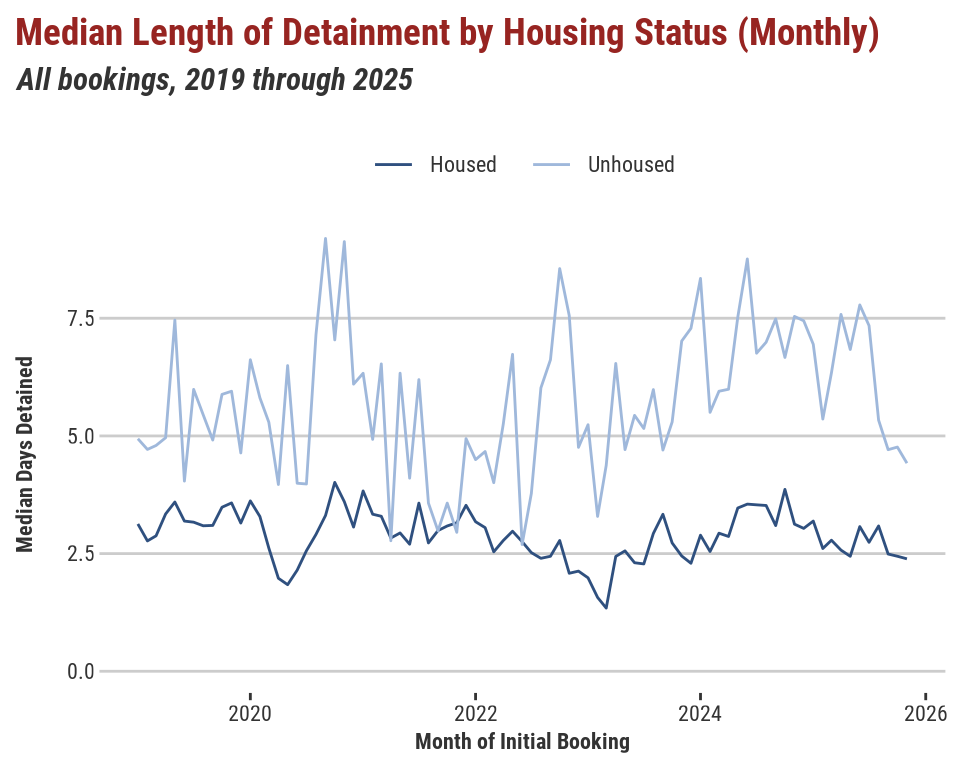
A tabular summary by year appears below.
| OCDC Population: Median Days Detained | ||
| By Year of Initial Booking | ||
| Arrest Year |
Days Detained
|
|
|---|---|---|
| Housed | Unhoused | |
| 2026 | 2.2 days | 4.21 days |
| 20251 | 2.66 days | 6 days |
| 2020 | 2.81 days | 6.13 days |
| 2024 | 3.19 days | 6.94 days |
| 2021 | 3.15 days | 4.54 days |
| 2022 | 2.63 days | 5.35 days |
| 2023 | 2.36 days | 5.41 days |
| 2029 | NA | -1095.55 days |
| 2099 | -27537.88 days | NA |
| Source: OK Policy Institute analysis of data from the Oklahoma County Detention Center's 'Jailtracker' system. | ||
| 1 Data through July 06, 2026 at 11:53 AM | ||
3.3 Trends: Cause of Booking
The table below shows the immediate reason (i.e. “new charge”, “new municipal charge”, “warrant”, etc.) for each booking event in the past year, broken out by housing status.
| OCDC Population: Immediate Cause of Booking | |||
| All Bookings July 06, 2025 through July 06, 2026 at 11:53 AM | |||
| How Arrest Made | Housed | Unhoused | Total |
|---|---|---|---|
| New State Charge | 8,694 (43.1%) | 1,096 (31.8%) | 9,790 (41.5%) |
| Municipal Charge/Commitment | 3,428 (17.0%) | 958 (27.8%) | 4,386 (18.6%) |
| OK County Warrant | 5,166 (25.6%) | 942 (27.3%) | 6,108 (25.9%) |
| Outside Agency Hold/Warrant | 872 (4.3%) | 178 (5.2%) | 1,050 (4.4%) |
| OK County Ordered Commitment | 722 (3.6%) | 127 (3.7%) | 849 (3.6%) |
| Non-OTN / Warrant | 241 (1.2%) | 41 (1.2%) | 282 (1.2%) |
| Writ ad Pro | 233 (1.2%) | 38 (1.1%) | 271 (1.1%) |
| Agency Print Card | 78 (0.4%) | 16 (0.5%) | 94 (0.4%) |
| Return to Custody/Surrender on Bond | 88 (0.4%) | 15 (0.4%) | 103 (0.4%) |
| Writ ad Test | 104 (0.5%) | 13 (0.4%) | 117 (0.5%) |
| OTN / Warrant | 27 (0.1%) | 11 (0.3%) | 38 (0.2%) |
| Courtesy Hold | 27 (0.1%) | 7 (0.2%) | 34 (0.1%) |
| Out of Custody/Walk Thru | 469 (2.3%) | 2 (0.1%) | 471 (2.0%) |
| Other / Unknown | 3 (0.0%) | 1 (0.0%) | 4 (0.0%) |
| Total | 20,152 (100.0%) | 3,445 (100.0%) | 23,597 (100.0%) |
| Source: OK Policy Institute analysis of data from the Oklahoma County Detention Center's 'Jailtracker' system. | |||