
1 Data / Methodology
The data for this report come from the Oklahoma County Detention Center’s (OCDC) JailTracker information system. Data includes information on all people booked into OCDC custody through July 06, 2026 at 11:53 AM.
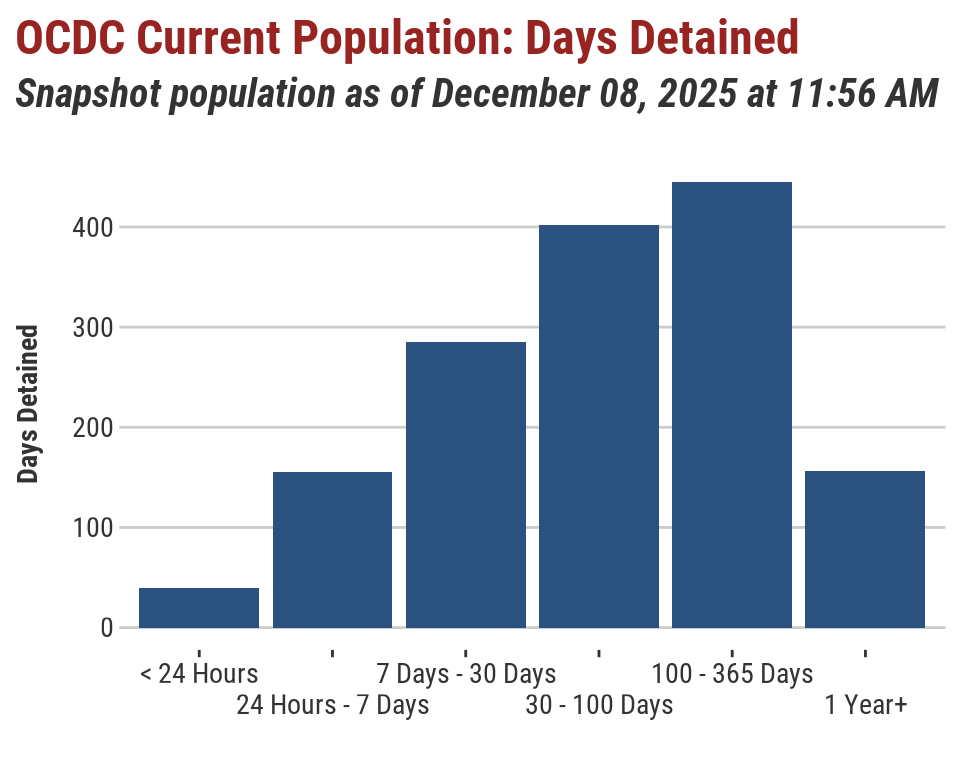
2 Length of Detainment: Current Population
At the time of the last data update (July 06, 2026 at 11:53 AM), there were 1,615 people currently in OCDC custody. The graph below shows how long each of them have been in custody as of that time.
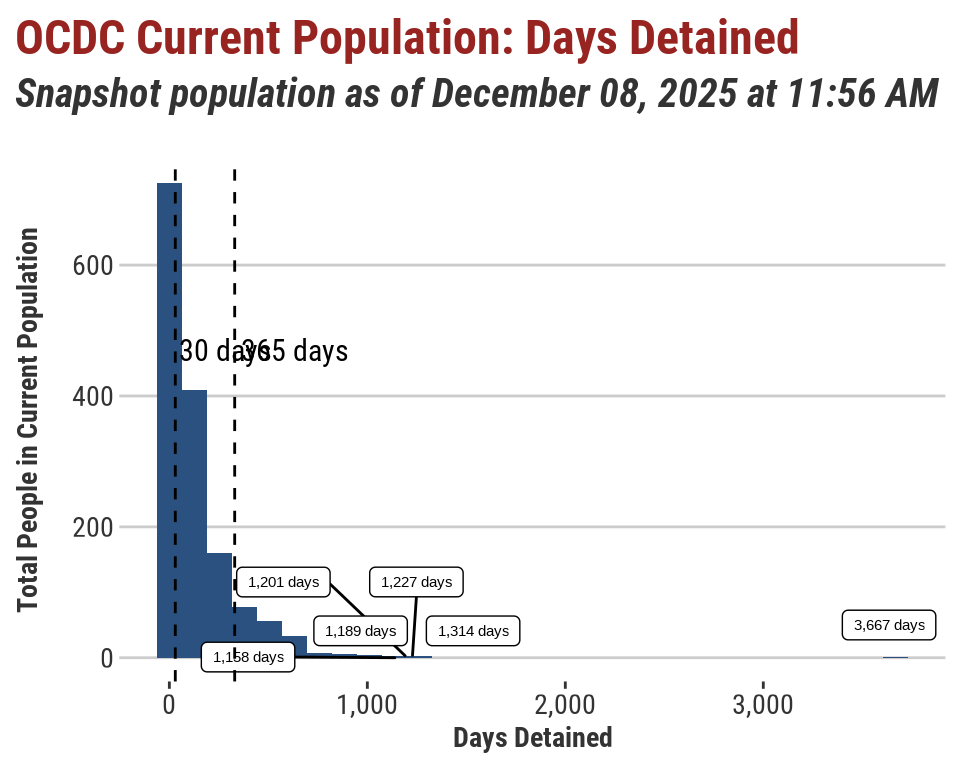
The histogram below provides a better look at the very long stays lasting multiple years. Dashed lines denote 30 days and one year, and each person detained longer than 3 years is noted individually.
2.1 Current Population: Demographics
The following tables provide demographic details of the pretrial population at OCDC at a single point in time.
| OCDC Population: Average Days Detained by Race | ||||
| Snapshot population as of July 06, 2026 at 11:53 AM | ||||
| Race | Total People | Median Days Held | Mean Days Held | Max Days Held |
|---|---|---|---|---|
| American Indian | 11 | 21.293 | 56.011 | 194.878 |
| Asian Pacific Islander | 15 | 36.357 | 83.588 | 296.866 |
| Black | 714 | 60.642 | 144.603 | 1,524.07 |
| Hispanic | 222 | 48.295 | 130.462 | 1,398.801 |
| Middle Eastern | 6 | 172.685 | 202.699 | 424.5 |
| Native American | 61 | 28.727 | 60.989 | 430.804 |
| Native Hawaiian Pacific Islander | 2 | 72.651 | 72.651 | 101.557 |
| Unknown | 6 | 165.022 | 290.272 | 838.558 |
| White | 578 | 47.382 | 119.19 | 5,553.036 |
| Total | 1,615 | 52.776 | 129.91 | 5,553.036 |
| Source: OK Policy Institute analysis of data from the Oklahoma County Detention Center's 'Jailtracker' system. | ||||
| Note: Demographic categories are as recorded by OCDC staff. | ||||
| OCDC Population: Average Days Detained by Gender | ||||
| Snapshot population as of July 06, 2026 at 11:53 AM | ||||
| Gender | Total People | Median Days Held | Mean Days Held | Max Days Held |
|---|---|---|---|---|
| Female | 240 | 30.941 | 84.318 | 1,368.278 |
| Male | 1,374 | 58.958 | 137.658 | 5,553.036 |
| Other | 1 | 435.26 | 435.26 | 435.26 |
| Total | 1,615 | 52.776 | 129.91 | 5,553.036 |
| Source: OK Policy Institute analysis of data from the Oklahoma County Detention Center's 'Jailtracker' system. | ||||
| Note: Demographic categories are as recorded by OCDC staff. | ||||
| OCDC Population: Average Days Detained by Age | ||||
| Snapshot population as of July 06, 2026 at 11:53 AM | ||||
| Age Group | Total People | Median Days Held | Mean Days Held | Max Days Held |
|---|---|---|---|---|
| 25-35 | 464 | 55.802 | 130.954 | 1,368.278 |
| 35-45 | 491 | 45.553 | 134.421 | 5,553.036 |
| 45-55 | 260 | 46.059 | 108.826 | 730.551 |
| 25 & Under | 256 | 64.535 | 147.118 | 1,190.498 |
| 55-65 | 110 | 39.311 | 89.122 | 882.106 |
| Over 65 | 33 | 87.584 | 206.82 | 1,398.801 |
| No Data / Unknown | 1 | 435.26 | 435.26 | 435.26 |
| Total | 1,615 | 52.776 | 129.91 | 5,553.036 |
| Source: OK Policy Institute analysis of data from the Oklahoma County Detention Center's 'Jailtracker' system. | ||||
| Note: Demographic categories are as recorded by OCDC staff. | ||||
2.2 Current Population: Security Classification and Length of Detainment
People held in OCDC custody are assigned a security classification of “minimum”, “medium”, or “maximum” security. It is determined on the basis of the charges they are accused of and the ongoing observations of the jail staff, and can be changed over time. It often takes 24-48 hours for this to be determined; recent bookings that haven’t yet been assigned a security classification are marked “No Data / Unknown”.
| OCDC Population by Days Detained and Security Level | ||||||||
| Snapshot population as of July 06, 2026 at 11:53 AM | ||||||||
| Security Level | 24 Hours | 24 Hours 7 Days | 7 Days 30 Days | 30 100 Days | 100 365 Days | 1 Year | No Data Unknown | Total |
|---|---|---|---|---|---|---|---|---|
| Maximum | 5 (10.9%) | 37 (18.4%) | 83 (23.4%) | 168 (36.8%) | 223 (54.4%) | 115 (78.2%) | NA (-) | 631 (39.1%) |
| Medium | 9 (19.6%) | 102 (50.7%) | 202 (57.1%) | 223 (48.9%) | 152 (37.1%) | 18 (12.2%) | NA (-) | 706 (43.7%) |
| Minimum | 10 (21.7%) | 61 (30.3%) | 69 (19.5%) | 65 (14.3%) | 35 (8.5%) | 13 (8.8%) | NA (-) | 253 (15.7%) |
| No Data / Unknown | 22 (47.8%) | 1 (0.5%) | NA (-) | NA (-) | NA (-) | 1 (0.7%) | 1 (100.0%) | 25 (1.5%) |
| Total | 46 (100.0%) | 201 (100.0%) | 354 (100.0%) | 456 (100.0%) | 410 (100.0%) | 147 (100.0%) | 1 (100.0%) | 1,615 (100.0%) |
| Source: OK Policy Institute analysis of data from the Oklahoma County Detention Center's 'Jailtracker' system. | ||||||||