
1 Overview
This is an overview report to provide some basic numbers about the current population and recent bookings at the Oklahoma County Detention Center (OCDC). It includes:
- The average OCDC population by month throughout 2025
- Rough estimates of the pretrial vs. sentenced population in the past year, based on weekly snapshots
- A summary of the most recent snapshot population (as of July 13, 2026 at 12:00 PM), including:
- Demographics (including race, gender, and security level)
- Most common charges
- Bond amounts
- A summary of the last three month’s of booking data, also covering:
- Demographics (including race, gender, and security level)
- Most common charges
1.1 Average population by month
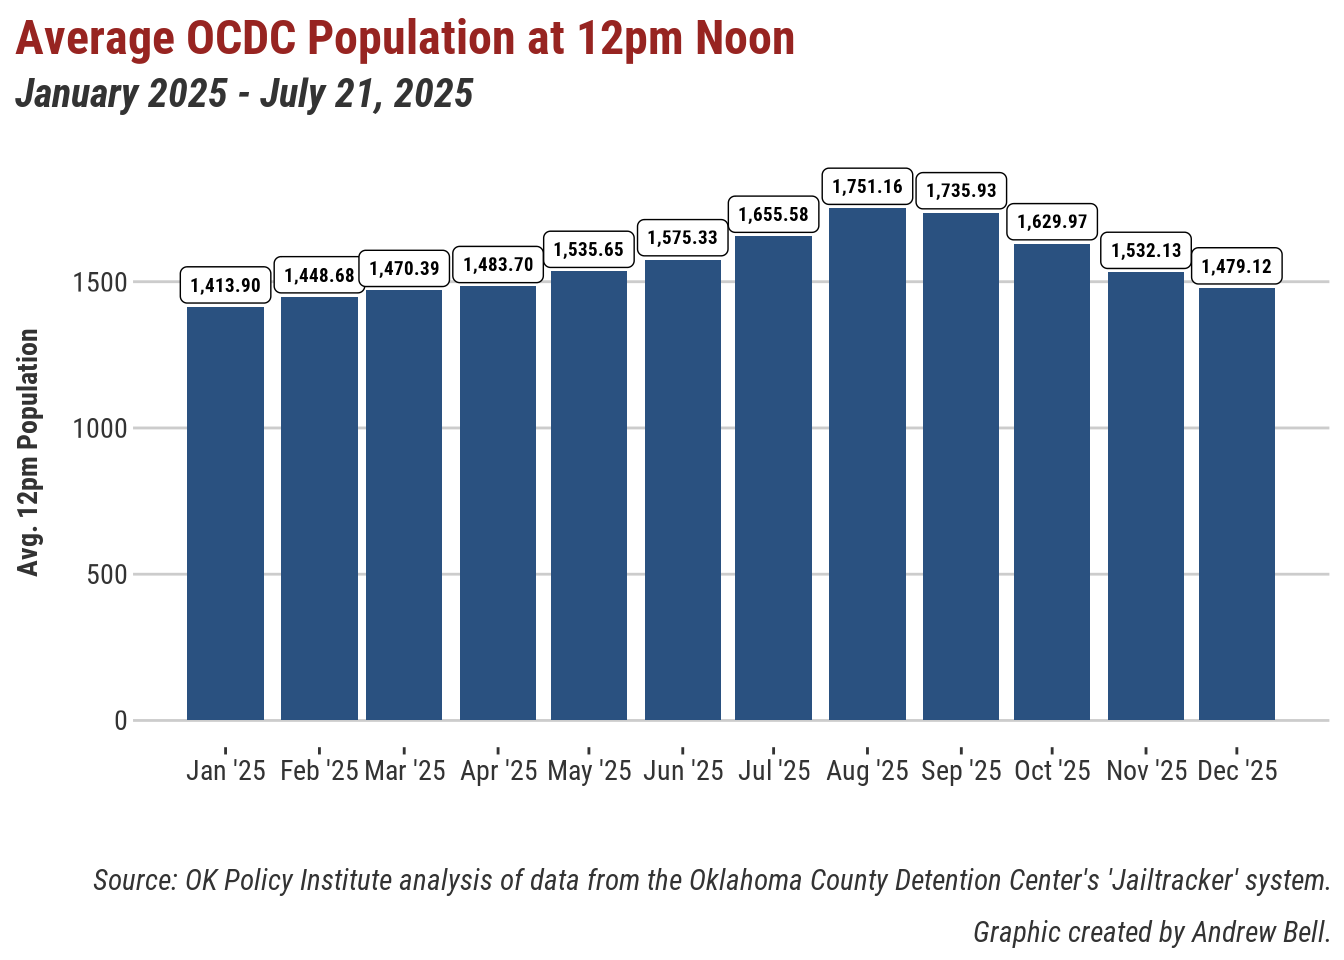
The graph below shows the average OCDC population at 12pm noon for each month so far in 2025.
The same information appears in tabular format below, along with the high / low mark within each month.
| Average OCDC Population at 12pm Noon | |||
| January 2025 - July 21, 2025 | |||
| Month | Avg Daily Pop | Lowest Daily Pop | Highest Daily Pop |
|---|---|---|---|
| January | 1,413.9 | 1,344 | 1,457 |
| February | 1,448.68 | 1,402 | 1,490 |
| March | 1,470.39 | 1,423 | 1,511 |
| April | 1,483.7 | 1,437 | 1,528 |
| May | 1,535.65 | 1,467 | 1,619 |
| June | 1,575.33 | 1,529 | 1,639 |
| July | 1,655.58 | 1,595 | 1,713 |
| August | 1,751.16 | 1,658 | 1,806 |
| September | 1,735.93 | 1,672 | 1,792 |
| October | 1,629.97 | 1,545 | 1,735 |
| November | 1,532.13 | 1,472 | 1,571 |
| December | 1,459.29 | 1,415 | 1,517 |
| January | 1,474.97 | 1,431 | 1,514 |
| February | 1,478.75 | 1,439 | 1,531 |
| March | 1,498.16 | 1,469 | 1,530 |
| April | 1,501.73 | 1,432 | 1,561 |
| May | 1,497.45 | 1,446 | 1,563 |
| June | 1,544.5 | 1,466 | 1,636 |
| July | 1,582.62 | 1,550 | 1,615 |
| Source: OK Policy Institute analysis of data from the Oklahoma County Detention Center's 'Jailtracker' system. | |||
| Graphic created by Andrew Bell. | |||
1.2 Average sentenced vs. pretrial by month
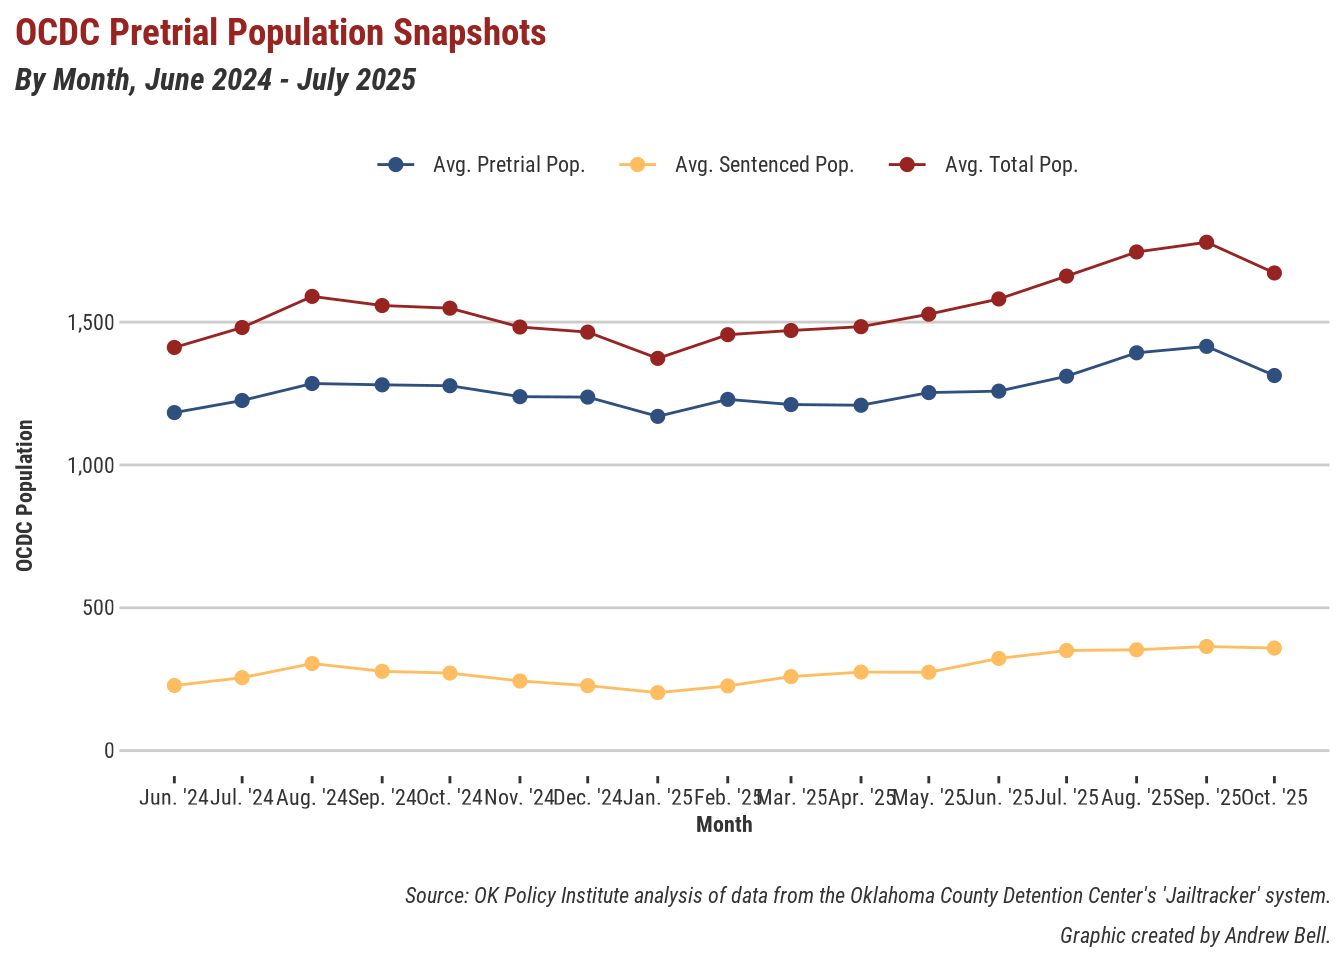
We still aren’t able to see the pretrial status of every individual person on any given day. I still think this will be possible eventually, but it will require a lot more complicated cleaning / joining datasets together / etc. to make it happen.
In the meantime, I’m going to keep using those weekly snapshots for anything retrospective. An updated version of that graph and table (including the most recent few snapshots) appear next.
| OCDC Pretrial Population Snapshots | |||||
| By Month, June 2024 - July 2025 | |||||
| Month | N Snapshots | Mean Total | Mean Pretrial | Mean Sentenced | Mean p Pretrial |
|---|---|---|---|---|---|
| October 2025 | 1 | 1,672.0 | 1,313.0 | 359.0 | 78.53% |
| September 2025 | 2 | 1,779.5 | 1,415.0 | 364.5 | 79.52% |
| August 2025 | 4 | 1,745.5 | 1,392.5 | 353.0 | 79.78% |
| July 2025 | 2 | 1,661.0 | 1,310.5 | 350.5 | 78.90% |
| June 2025 | 3 | 1,581.0 | 1,258.3 | 322.7 | 79.58% |
| May 2025 | 3 | 1,527.7 | 1,253.3 | 274.3 | 82.05% |
| April 2025 | 2 | 1,484.0 | 1,209.0 | 275.0 | 81.47% |
| March 2025 | 5 | 1,470.6 | 1,211.4 | 259.2 | 82.37% |
| February 2025 | 2 | 1,456.0 | 1,229.5 | 226.5 | 84.45% |
| January 2025 | 1 | 1,373.0 | 1,170.0 | 203.0 | 85.21% |
| December 2024 | 2 | 1,465.0 | 1,237.5 | 227.5 | 84.47% |
| November 2024 | 4 | 1,482.8 | 1,239.0 | 243.8 | 83.57% |
| October 2024 | 4 | 1,548.8 | 1,277.2 | 271.5 | 82.47% |
| September 2024 | 5 | 1,558.0 | 1,280.4 | 277.6 | 82.18% |
| August 2024 | 4 | 1,590.0 | 1,285.0 | 305.0 | 80.80% |
| July 2024 | 5 | 1,481.0 | 1,225.6 | 255.4 | 82.79% |
| June 2024 | 4 | 1,411.2 | 1,183.2 | 228.0 | 83.85% |
| Source: OK Policy Institute analysis of data from the Oklahoma County Detention Center's 'Jailtracker' system. | |||||
| Graphic created by Andrew Bell. | |||||
2 Current Snapshot Population Data
First, we’ll look at the most recent snapshot population. This is what the jail’s population looked like at the moment of our latest data update, on July 13, 2026 at 12:00 PM, when there was a total of 1,591 people in custody.
2.1 Demographics
2.1.1 Race
| OCDC Population by Race | |
| Snapshot population as of July 13, 2026 at 12:00 PM | |
| Race | N |
|---|---|
| Black | 715 (44.9%) |
| White | 568 (35.7%) |
| Hispanic | 210 (13.2%) |
| Native American | 60 (3.8%) |
| American Indian | 12 (0.8%) |
| Asian Pacific Islander | 12 (0.8%) |
| Unknown | 6 (0.4%) |
| Middle Eastern | 5 (0.3%) |
| Native Hawaiian Pacific Islander | 3 (0.2%) |
| Total | 1,591 (100.0%) |
| Source: OK Policy Institute analysis of data from the Oklahoma County Detention Center's 'Jailtracker' system. | |
| Note: Demographic categories are as recorded by OCDC staff. | |
2.1.2 Gender
| OCDC Population by Gender | |
| Snapshot population as of July 13, 2026 at 12:00 PM | |
| Gender | N |
|---|---|
| Male | 1,351 (84.9%) |
| Female | 239 (15.0%) |
| Other | 1 (0.1%) |
| Total | 1,591 (100.0%) |
| Source: OK Policy Institute analysis of data from the Oklahoma County Detention Center's 'Jailtracker' system. | |
| Note: Demographic categories are as recorded by OCDC staff. | |
2.1.3 Security level
| OCDC Population by Security Classification | |
| Snapshot population as of July 13, 2026 at 12:00 PM | |
| Security Level | N |
|---|---|
| Medium | 674 (42.4%) |
| Maximum | 657 (41.3%) |
| Minimum | 250 (15.7%) |
| No Data / Unknown | 10 (0.6%) |
| Total | 1,591 (100.0%) |
| Source: OK Policy Institute analysis of data from the Oklahoma County Detention Center's 'Jailtracker' system. | |
| Note: Demographic categories are as recorded by OCDC staff. | |
2.2 Most common charges
The most common charges among the people in the snapshot population appear in the tables below. Since there are often multiple charges in a given case, we typically focus on the top charge in each case (i.e. the one with the most serious potential sentences upon conviction).
The table below shows the top charge for each person in the snapshot population. Again, this is only considering the most serious charge of each person in the jail at a single point in time.
| OCDC Population: Most Common Charges | ||||||
| Snapshot population as of July 13, 2026 at 12:00 PM | ||||||
| Rank | Top Charge | N | Percent Pretrial | Percent Max Security | Percent Unhoused | Median Days |
|---|---|---|---|---|---|---|
| #1 | CDS Trafficking / Distribution | 148 | 78.38% | 37.16% | 11.49% | 63.031 |
| #2 | Assault / Battery (Dangerous Weapon) | 110 | 80.00% | 29.09% | 21.82% | 70.113 |
| #3 | Murder (First Degree) | 104 | 90.38% | 100.00% | 4.81% | 347.333 |
| #4 | Child Abuse / Neglect / Sexual Abuse | 70 | 75.71% | 78.57% | 4.29% | 80.182 |
| #5 | Assault / Battery (On Official) | 63 | 88.89% | 28.57% | 22.22% | 68.552 |
| #6 | Domestic Assault / Battery (Dangerous Weapon) | 58 | 82.76% | 25.86% | 10.34% | 80.378 |
| #7 | Domestic Assault / Battery (Simple) | 56 | 73.21% | 12.50% | 7.14% | 42.999 |
| #8 | Robbery (With a Dangerous Weapon) | 43 | 88.37% | 48.84% | 9.30% | 103.752 |
| #9 | Burglary (Second Degree) | 42 | 90.48% | 7.14% | 33.33% | 29.761 |
| #10 | Burglary (First Degree) | 38 | 89.47% | 42.11% | 31.58% | 55.006 |
| #11 | Driving Under the Influence / Actual Physical Control | 34 | 88.24% | 8.82% | 8.82% | 9.401 |
| #12 | Failure to Comply With Sex Offender Registration Act | 34 | 52.94% | 97.06% | 52.94% | 75.319 |
| #13 | Obstruction of Justice | 33 | 75.76% | 3.03% | 15.15% | 18.945 |
| #14 | Rape (First Degree) | 31 | 87.10% | 77.42% | 25.81% | 133.767 |
| #15 | Resisting / Eluding Officer | 31 | 83.87% | 58.06% | 16.13% | 13.752 |
| Source: OK Policy Institute analysis of data from the Oklahoma County Detention Center's 'Jailtracker' system. | ||||||
2.3 Bonds
Our new data also allows us to see some information about the bonds in each case. This can get very complicated, since there are multiple cases / charges / bond amounts and types listed for each individual person, and it’s not always clear how well the jail’s data matches up with reality (i.e. the court’s data). I’m just now starting to dig into this part of the data, so please keep in mind that this is a very rough first attempt.
- I definitely noticed some things in this data that don’t make sense while I was putting it together (like cases where the bond type was “Held without bond” but an amount was listed, or cases with murder charges that say “No bond required”, etc.).
- All this to say – I would take this bond stuff with a big grain of salt until I can A) talk to the jail staff to clarify what everything means, and B) spend more time cleaning and understanding this data.
Even though it’s still very much a work in progress, I did want to include this just so you can see what it looks like at the moment. The table below shows my attempt at summarizing the bond type of each person included in the snapshot population. Again, this is an attempt at summarizing the bond situation in all the charges / cases associated with their booking.
| OCDC Population Bond Summary | |
| Snapshot population as of July 13, 2026 at 12:00 PM | |
| Person Bond Type | N |
|---|---|
| Cash / Bail | 1,114 |
| Held without Bond | 428 |
| Unknown / No Data | 25 |
| No Bond Required | 24 |
| Source: OK Policy Institute analysis of data from the Oklahoma County Detention Center's 'Jailtracker' system. | |
This next graph shows the overall bond amount for each booking (excluding those in the “Held without bond” category). This is based on the highest value listed – i.e. if a person had two charges, one with a bond listed at $250 and one at $500, their overall bond amount would simply be $500. Because this can range from a few hundred dollars into the millions, it is displayed using a log scale.
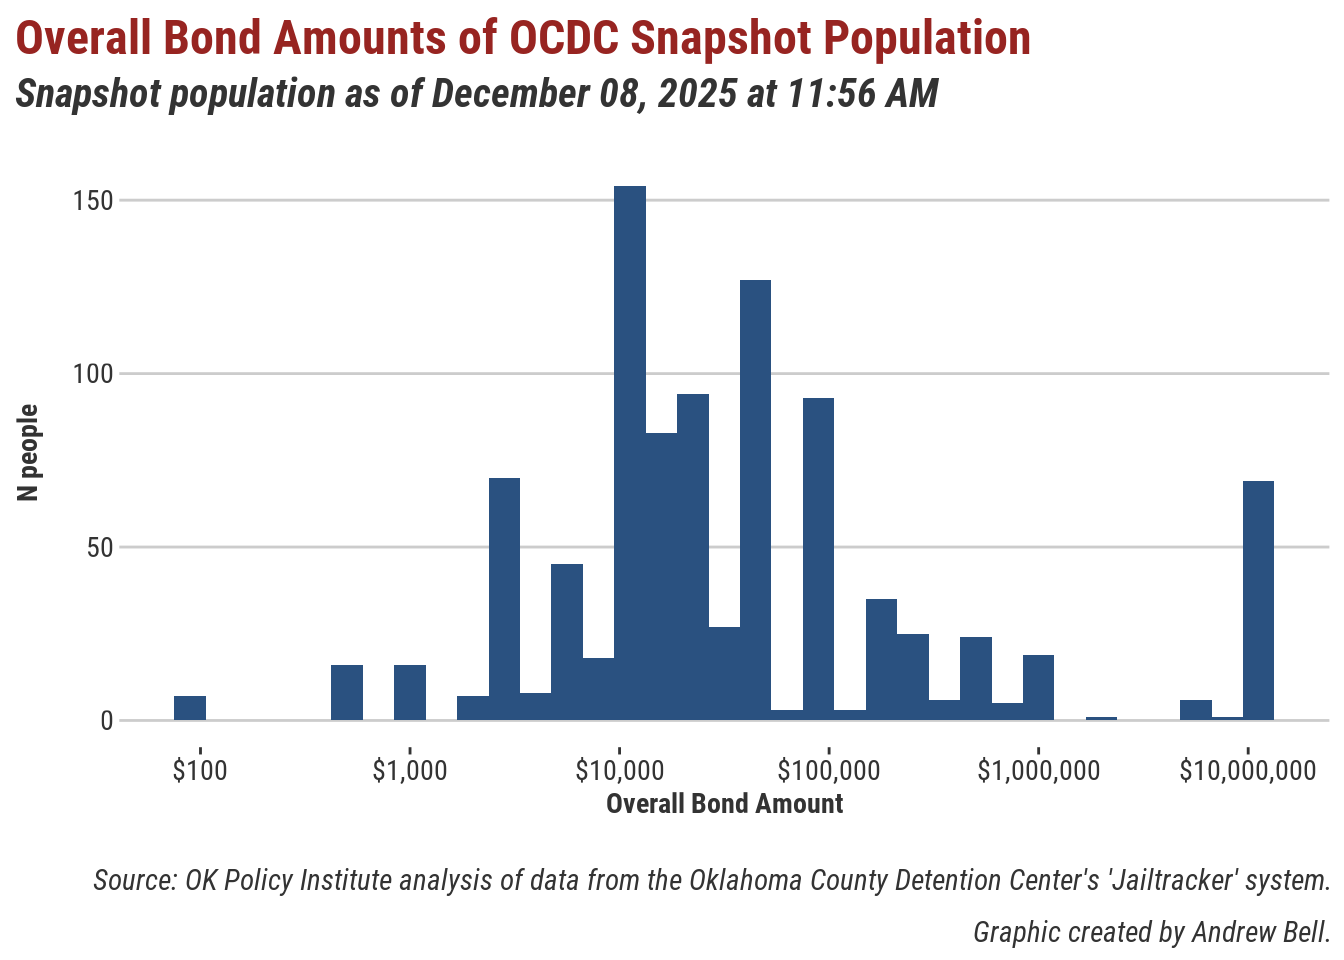
As the graph shows, most people currently in custody had bond amounts in the range of thousands / tens of thousands of dollars. Around 50-60 or so had outlier bond amounts approaching $10 million and above – these were all for either first degree murder or sexual abuse of a child.
3 Recent Booking / Release Data
Next, we’ll look at the last three months of booking data. It’s important to look at this in addition to the snapshot population, so we can see the impact of short term, high frequency bookings (often for “low level” charges).
This includes everyone booked into OCDC custody in the past three months (since April 01, 2026).
3.1 Demographics
3.1.1 Race
| OCDC Booking Events by Race | |
| All bookings April 01, 2026 through July 13, 2026 | |
| Race | N |
|---|---|
| White | 3,259 (41.6%) |
| Black | 3,255 (41.5%) |
| Hispanic | 834 (10.6%) |
| Native American | 301 (3.8%) |
| Asian Pacific Islander | 87 (1.1%) |
| Unknown | 40 (0.5%) |
| American Indian | 31 (0.4%) |
| Middle Eastern | 21 (0.3%) |
| Native Hawaiian Pacific Islander | 7 (0.1%) |
| Total | 7,835 (100.0%) |
| Source: OK Policy Institute analysis of data from the Oklahoma County Detention Center's 'Jailtracker' system. | |
| Note: Demographic categories are as recorded by OCDC staff. | |
3.1.2 Gender
| OCDC Booking Events by Gender | |
| All bookings April 01, 2026 through July 13, 2026 | |
| Gender | N |
|---|---|
| Male | 5,948 (75.9%) |
| Female | 1,877 (24.0%) |
| Other | 10 (0.1%) |
| Total | 7,835 (100.0%) |
| Source: OK Policy Institute analysis of data from the Oklahoma County Detention Center's 'Jailtracker' system. | |
| Note: Demographic categories are as recorded by OCDC staff. | |
3.1.3 Security level
| OCDC Booking Events by Security Classification | |
| All bookings April 01, 2026 through July 13, 2026 | |
| Security Level | N |
|---|---|
| Medium | 2,778 (35.5%) |
| Minimum | 2,241 (28.6%) |
| No Data / Unknown | 1,838 (23.5%) |
| Maximum | 978 (12.5%) |
| Total | 7,835 (100.0%) |
| Source: OK Policy Institute analysis of data from the Oklahoma County Detention Center's 'Jailtracker' system. | |
| Note: Demographic categories are as recorded by OCDC staff. | |
3.2 Most common charges
The most common charges among the people booked in the past three months appear in the tables below. Again, we focus on the top charge in each case (i.e. the one with the most serious potential sentences upon conviction).
| OCDC Booking Events: Most Common Charges | |||||
| All bookings April 01, 2026 through July 13, 2026 | |||||
| Rank | Top Charge | N | Percent Max Security | Percent Unhoused | Median Days |
|---|---|---|---|---|---|
| #1 | Driving Under the Influence / Actual Physical Control | 856 | 1.87% | 3.39% | 0.918 |
| #2 | CDS Possession (Simple) | 452 | 1.77% | 14.38% | 1.577 |
| #3 | CDS Trafficking / Distribution | 403 | 19.35% | 12.16% | 19.047 |
| #4 | Domestic Assault / Battery (Simple) | 351 | 4.56% | 3.42% | 4.184 |
| #5 | Larceny (Shoplifting) | 317 | 5.05% | 18.61% | 2.239 |
| #6 | Obstruction of Justice | 279 | 1.08% | 17.20% | 1.641 |
| #7 | Assault / Battery (Dangerous Weapon) | 266 | 13.91% | 16.54% | 10.793 |
| #8 | Fugitive From Justice | 229 | 12.23% | 12.66% | 4.373 |
| #9 | Trespassing After Being Forbidden | 227 | 2.20% | 28.19% | 0.629 |
| #10 | Resisting / Eluding Officer | 212 | 46.70% | 16.98% | 7.729 |
| #11 | Public Intoxication | 196 | 0.51% | 14.29% | 0.484 |
| #12 | Burglary (Second Degree) | 189 | 10.58% | 24.34% | 13.5 |
| #13 | Receiving / Concealing Stolen Property | 188 | 10.64% | 9.57% | 4.454 |
| #14 | Child Abuse / Neglect / Sexual Abuse | 177 | 37.85% | 5.08% | 5.162 |
| #15 | Domestic Assault / Battery (Dangerous Weapon) | 173 | 10.40% | 6.36% | 15.81 |
| #16 | Assault / Battery (On Official) | 159 | 11.32% | 18.87% | 20.515 |
| #17 | Illegal Possession of a Firearm | 158 | 12.03% | 6.33% | 2.974 |
| #18 | Assault / Battery (Simple) | 149 | 4.70% | 14.77% | 0.727 |
| #19 | Conspiracy (Other / Unspecified) | 142 | 30.99% | 7.04% | 11.484 |
| #20 | CDS Paraphernalia Possession / Distribution | 139 | 3.60% | 24.46% | 1.724 |
| Source: OK Policy Institute analysis of data from the Oklahoma County Detention Center's 'Jailtracker' system. | |||||